St. Pete Property-Risk Analysis
A deep dive into storm surge, pluvial rain risk, and sewer-overflow vulnerability
- Role
- Solo (data pipeline, modeling, UI)
- Timeline
- Personal project · 2026
- Stack
- DuckDB · dbt · FastAPI · Next.js + MapLibre
The question
There are many factors to consider when buying a house in Florida: Hurricanes, storm surge, sinkholes, mold issues, termites, insurance costs, and even market conditions. When I decided to buy a house, I found the current platforms for doing an analysis were inadequate, specifically for assessing storm surge risk. Additionally, the flood maps are dated, and I've heard FEMA will be redrawing them soon. After a lot of thought, I came up with these criteria for my house:
- Block construction
- Slab foundation
- FEMA Zone X (non-flood zone)
- In either Evacuation Zone E or Non-Evac
- At least 20 feet above sea level, 25-30 is ideal
- Not a flip
Using the current tools to house hunt (Zillow, Redfin, Realtor), I found that I couldn't easily filter a search for my requirements. They don't include elevation or evacuation zone, and it takes a lot of manual digging to figure out which houses have been flipped or how they are constructed. This led me to build a thorough analysis of the St. Pete housing market. In the end, I found my house. I had to trade some of my nice-to-haves for the criteria that decreases the chances of my home being damaged. I decided to go with less square footage, for instance.
The data
Ten sources, joined at the parcel, zip, and sewershed level: county parcel records and sales history (PCPAO / FL DOR), building permits, Zillow & Redfin market metrics, Census ACS demographics, FEMA flood-claim history, the city's stormwater & sanitary-sewer networks (St. Pete GeoHub), and USGS 3DEP ground elevation.
These sources don't share keys, flood zones aren't a native parcel field (I spatial-joined FEMA FIRM maps to parcel lat/lon), and insurance has to be estimated per property. The figures below come from that joined dataset.
What the data showed
I wanted to go deeper on flood exposure than "is this house in Flood Zone X?" While digging, I decided to use this as an opportunity to learn how to build a catastrophe model around it. The TLDR: the market hasn't finished pricing flood risk, and elevation is the hedge.
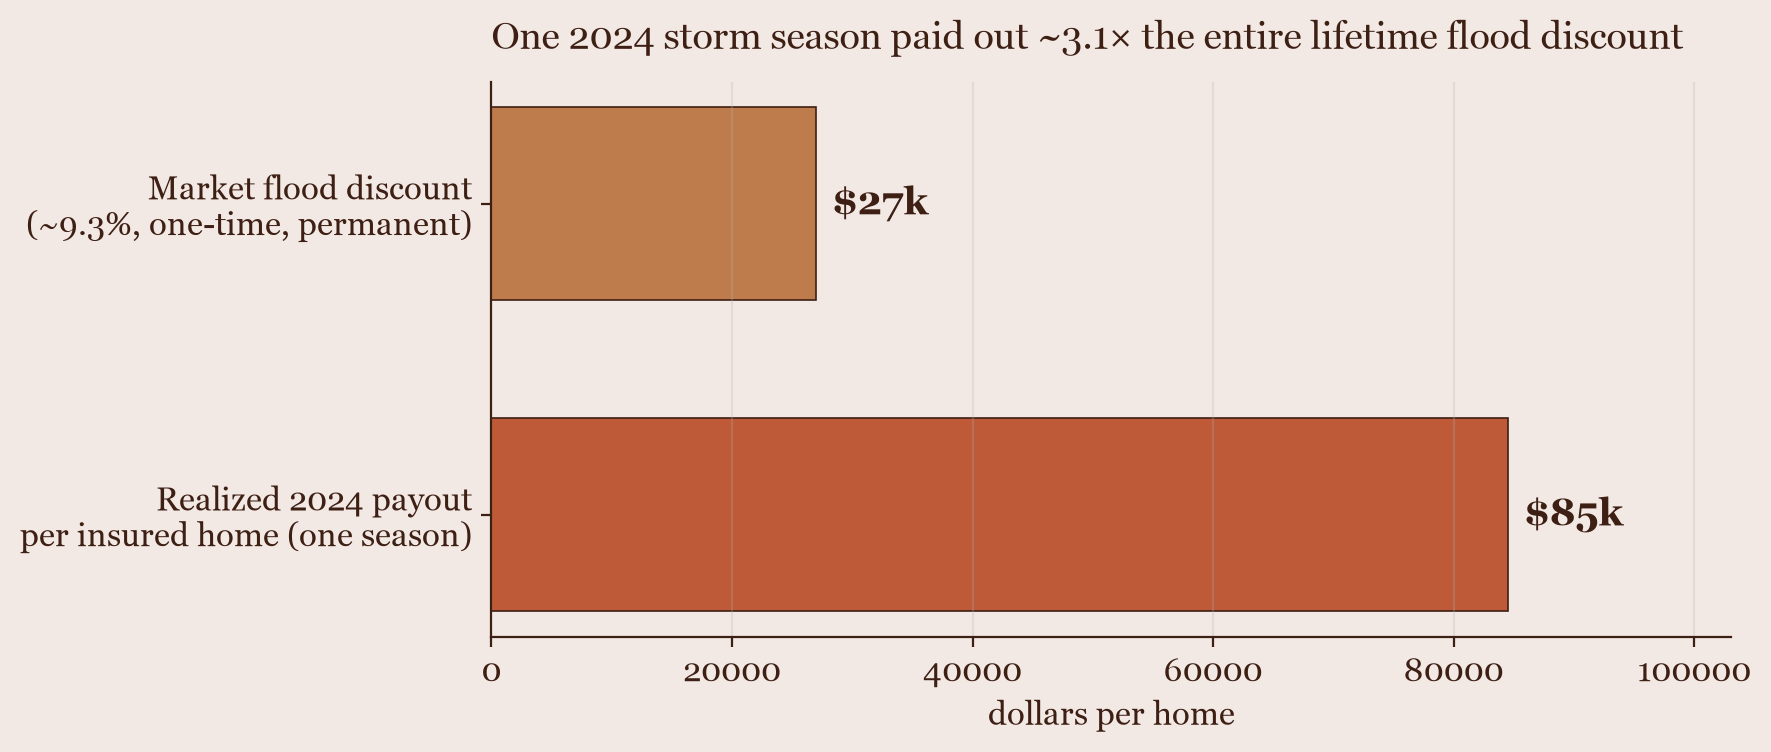
The market's flood discount is about 3× too small
Buyers haircut a flood-zone home by ~9.3% — about $27k off the median, a one-time, permanent discount. But a single 2024 storm season (Helene + Milton) paid out roughly $85k per insured home in flood-heavy block groups: ~3× the entire lifetime discount, in one season. Federally subsidized flood insurance has absorbed that cost so it never had to show up in the price — and FEMA's Risk Rating 2.0 is now unwinding the subsidy onto premiums, which do capitalize into price. Flood-zone homes carry repricing downside the current discount doesn't reflect.
It's an elevation story, and two independent methods agree
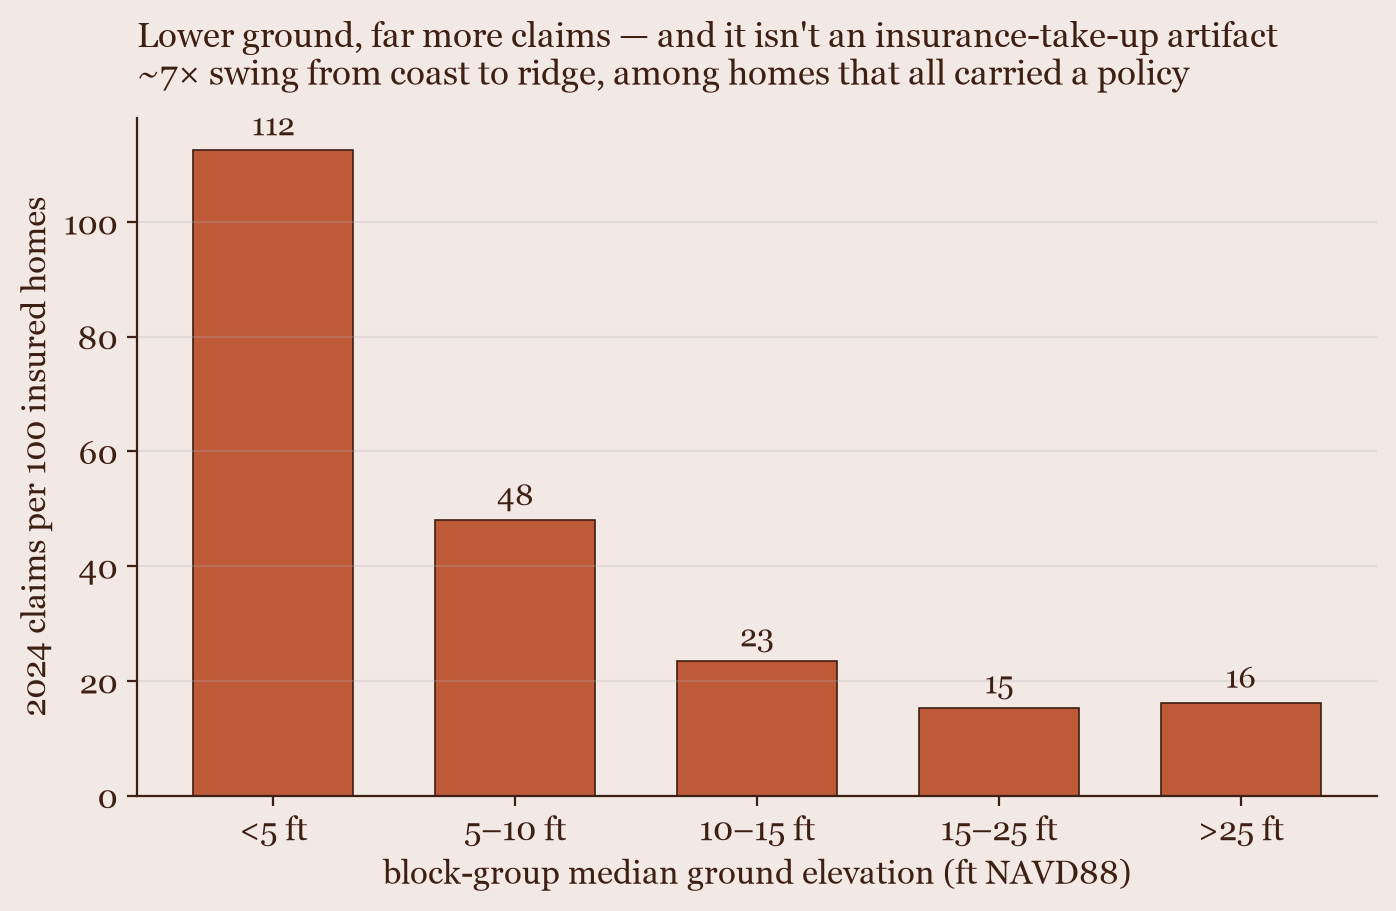
Read straight off the federal claims data, with no model in the loop: a block group's low-lying ground predicts its 2024 NFIP claims better than its average does (rank correlation ρ ≈ −0.77), and the gradient survives normalizing for who bought insurance — a ~7× swing in claim frequency from coast to ridge among homes that all carried a policy. A from-scratch flood catastrophe model, built from elevation and depth-damage physics, then reproduces the same result (the dry 33713 ridge contributes ≈ $0 of modeled loss). Two roads, same destination.
FEMA's "safe" label is trustworthy for surge: Zone X is real high ground
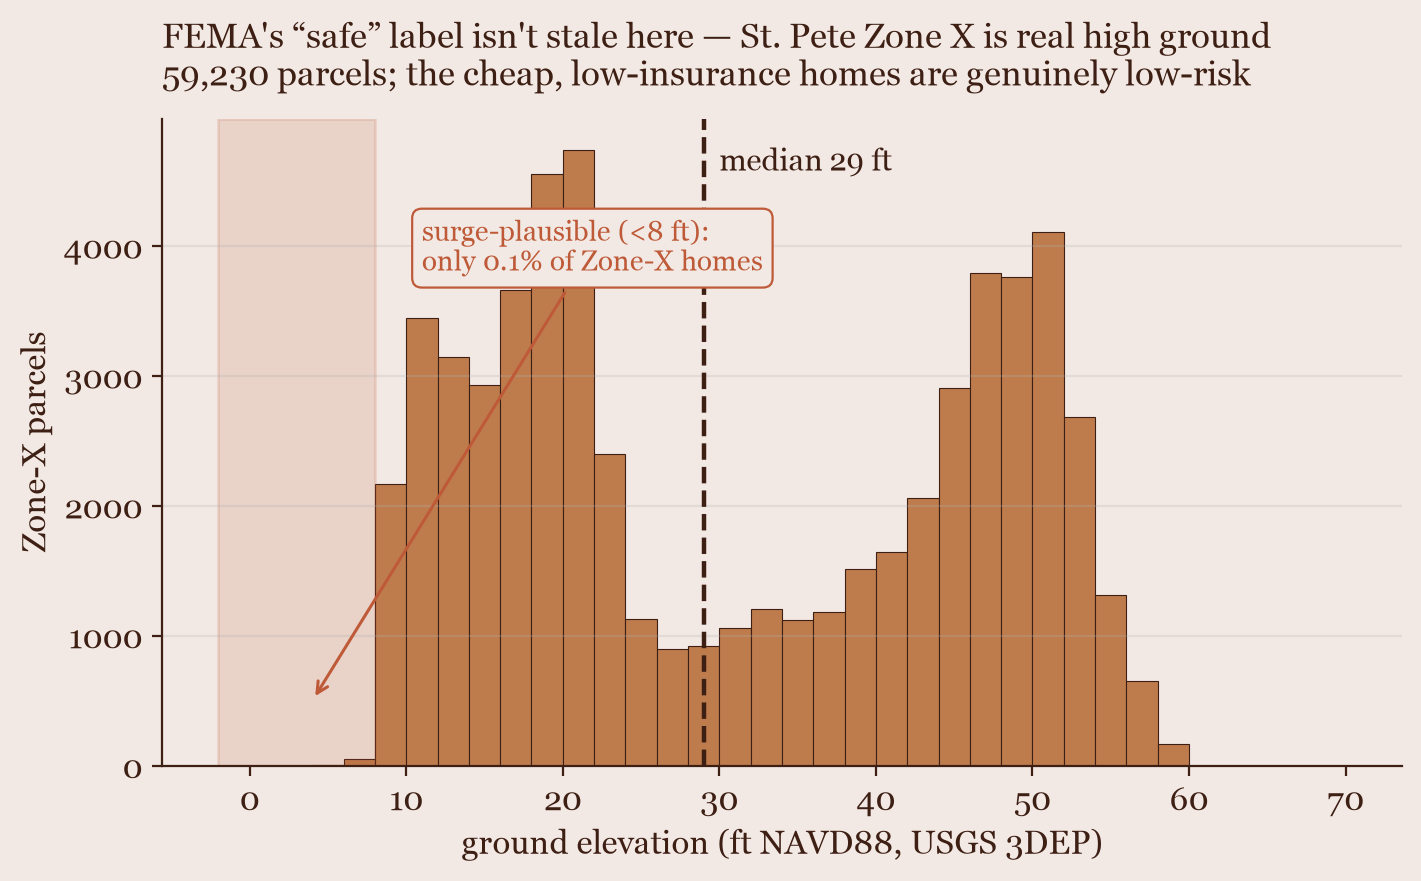
The skeptic's worry is that the flood maps are stale and the cheap, low-insurance "Zone X" homes are hiding risk. In St. Pete they aren't: sampling ground elevation for all 59,230 Zone-X parcels puts the median at 29 ft, with only 0.1% below the surge-plausible 8 ft line. The label corresponds to genuine elevation — so a dry, high-ground Zone-X home isn't just safer, it's on the right side of the repricing flood-zone homes haven't taken yet. (Honest caveat: this holds in St. Pete, not county-wide — a 99%-Zone-X pocket in inland Largo still took ~$26M in rain-driven flooding.) Zone X is trustworthy about surge — but it says nothing about rainfall, drainage, or the sewer network, each its own layer (next).
The hazard the flood map and my own surge model both miss: rainfall
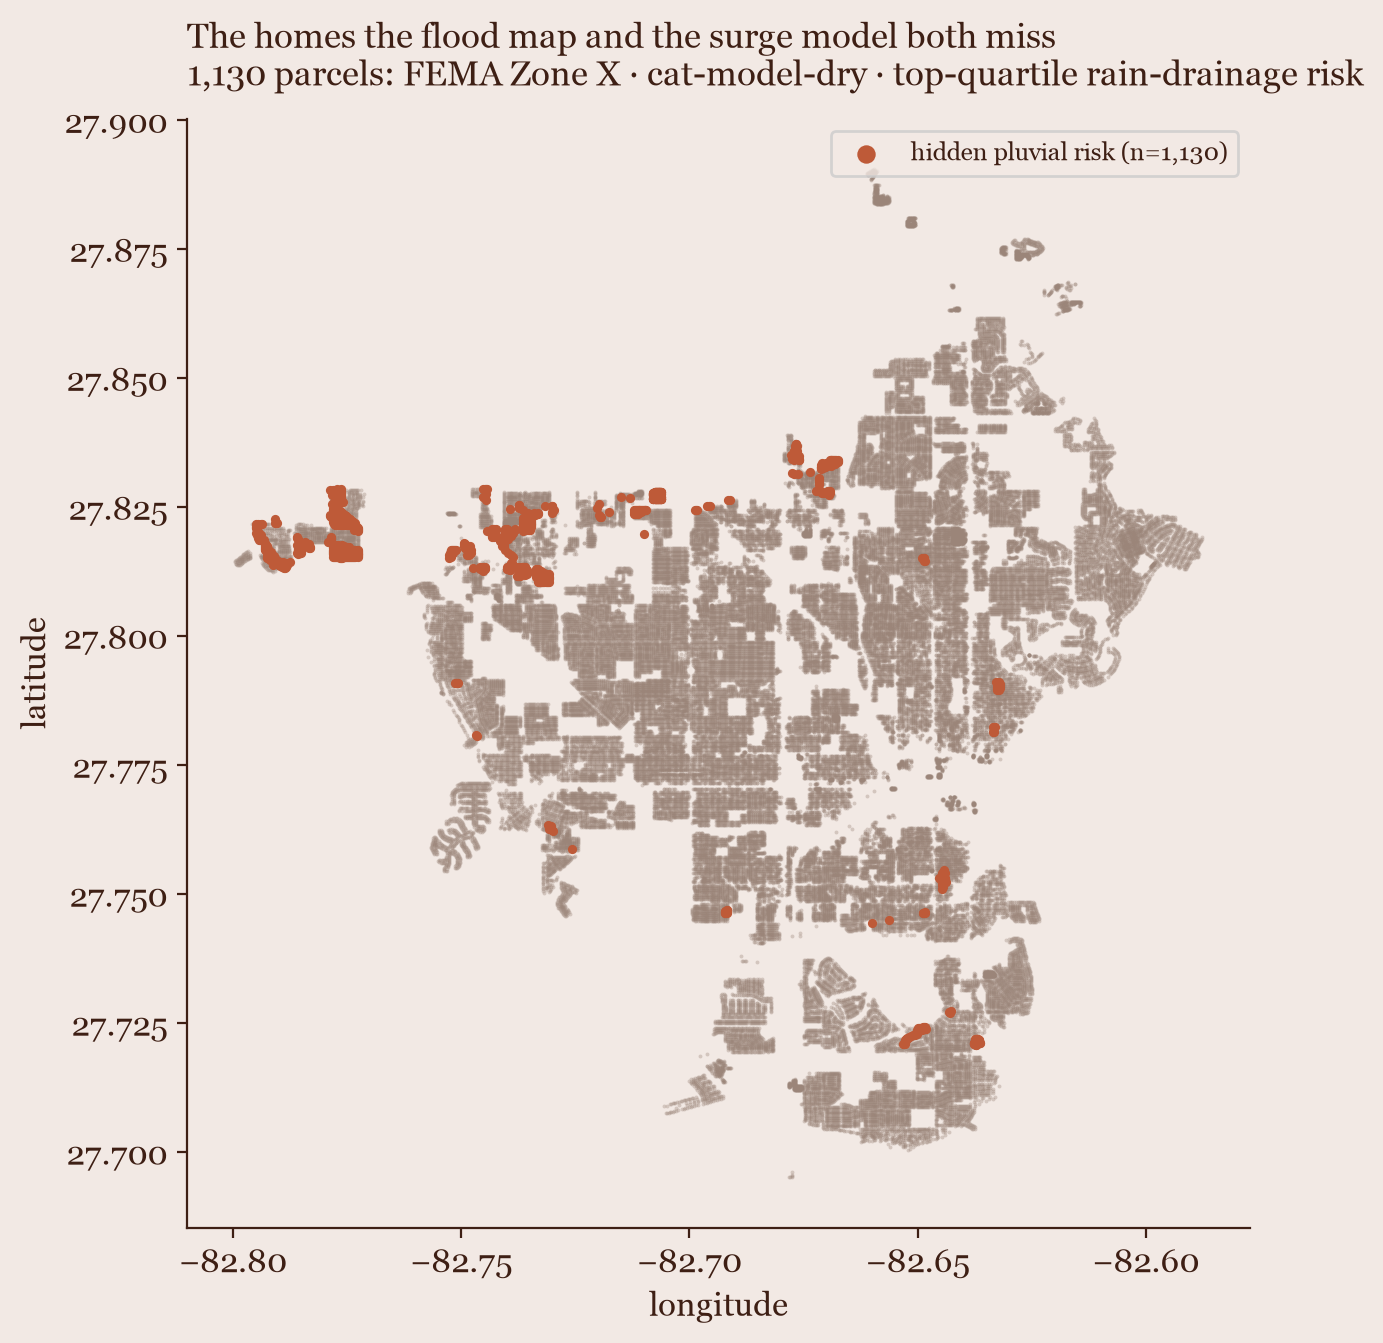
Surge isn't the only way water reaches a house. I ingested St. Pete's actual storm-drain network (~22k inlets, ~4k outfalls) and scored every parcel on pluvial risk — low ground that's poorly served by drainage, where heavy rain ponds with nowhere to go. It flags 1,130 homes that FEMA calls Zone X and my surge model leaves bone-dry, yet sit low and under-drained — the inland-Largo caveat above, now mapped citywide. It's the local-infrastructure layer Zillow and even First Street structurally can't see. Honest caveat: a relative screen, not a validated probability — there's no public record of where it actually floods, so this points at suspects, not verdicts.
A third water hazard the map can't see: the sewer itself backing up
Rain ponding on the surface is one failure mode; the sanitary sewer overflowing in wet weather is another. Using the city's sewer-network condition data, I scored all 151 sewersheds for inflow & infiltration (I&I) risk: unlined clay pipe, inflow-prone manholes, and deep manholes, the plumbing drivers of wet-weather overflows, independent of topography. It's a genuinely distinct layer, not a restatement of the rain-drainage score: the correlation between the two is essentially zero (ρ ≈ −0.03). The payoff is the overlap. 12 of the 151 sewersheds fall in the worst quartile of both, the "double-jeopardy" areas where heavy rain ponds on the surface and the sewer is most prone to back up. Honest caveat: a relative percentile screen, not an overflow probability. The condition data has gaps (pipe-lining status is known for only ~22% of the network) and there's no public overflow-event record to validate against (the national EPA dataset carries zero Florida records), so it ranks suspects, not confirmed failures.
How I built it
I built this to run locally to save on cloud costs. Python scripts ingest each source into DuckDB, an in-process analytical database; dbt models turn the raw tables into the decision metrics above; a read-only FastAPI layer serves them; and a Next.js + MapLibre map-first UI puts every parcel on the map. DuckDB in-process means no infrastructure and fast iteration, the right call for a single-user decision tool. The latest extension ingests the city's stormwater and sanitary-sewer networks (St. Pete GeoHub) and adds two more vulnerability layers — pluvial drainage risk and an I&I sewer-overflow index — beyond the original surge model.
- DuckDB
- dbt
- Python · pandas
- FastAPI
- Next.js
- MapLibre GL
- Census ACS API
- FEMA OpenFEMA
- PCPAO parcel data
- marimo
What I learned
- What started out as pure exploration to answer a question became an opportunity to advance my skill in agentic analytics. Before LLMs, I was a data analyst, so my insights were hard-won and my code was hand-written. I've been building with AI for a few years, but that hasn't crossed over to my analytics work. I wanted to find the space between doing everything myself and having an LLM do everything for me. This project helped me get closer to that goal.
- DuckDB + dbt running locally is a genuinely great analytics stack: no infrastructure, fast iteration, and real transformation discipline without a warehouse bill.
- Marimo notebooks are extremely useful for agentic analytics! Discovering this tool made a big difference in my workflow.
- Verify the data before trusting it. This round I found outfall elevations were stored in centimeters (not feet), coverage-tested a national sewer-overflow dataset and discovered it carries zero Florida records, and ran a scientific-code linter over the analysis — each one changed a conclusion or saved a wrong one.
Data & metrics
Ten public sources, joined at the parcel, zip, and sewershed level.
| Source | Grain | Provider |
|---|---|---|
| Parcels | 1 row / parcel | PCPAO |
| Sales history | 1 row / transaction | PCPAO · FL DOR |
| Permits | 1 row / permit | StPeteStat · PCPAO |
| Market metrics | zip + month | Zillow Research · Redfin |
| Demographics | zip + year | Census ACS |
| Flood claims | zip + year | FEMA OpenFEMA |
| Listings | 1 row / listing | Zillow · Redfin |
| Stormwater network | 1 row / asset | St. Pete GeoHub |
| Wastewater network | 1 row / asset | St. Pete GeoHub |
| Ground elevation | per parcel | USGS 3DEP DEM |
Derived metrics
- true_monthly_cost
- PITI + insurance + HOA/CDD. The primary apples-to-apples cost comparison across listings.
- flip_score
- Days-to-relist + permit activity in that window + price delta vs. zip comp. Flags cosmetic flips priced at 2–3× replacement cost.
- rental_exit_yield
- Net yield after insurance, taxes, property management, and vacancy. Must be positive to qualify as a rental exit.
- flood_risk_score
- FEMA zone (spatial-joined onto parcels) plus NFIP claims history by zip.
- neighborhood_momentum
- Permit-rate trend + days-on-market trend + price-cut rate + ACS income growth.
The full analysis
Static exports of the marimo notebooks behind the findings above. Read-only snapshots, but the interactive charts still respond.
- 00 · Overview & narrative index ↗
- 01 · Disqualifier criteria funnel ↗
- 02 · Flood & wind risk landscape ↗
- 03 · Social vulnerability ↗
- 04 · Parcel flood penalty (repeat-sales) ↗
- 05 · Block-group flood mechanism ↗
- 06 · Ridge decoupling (decision log) ↗
- 07 · Elevation vs. realized 2024 claims ↗
- 08 · Flood cat-model validation ↗
- 09 · Is flood risk priced right? ↗
- 10 · Stormwater & sewer network (foundation) ↗
- 11 · Pluvial (rain-drainage) risk ↗
- 12 · Sewer-overflow vulnerability ↗